BlueControl
The primary function of the software is to create, download, and save device configurations and profiles. Depending on the device, other functions may be possible, such as changes to the device function; adding additional screens to the operating mode, changing the function of the displays or LEDs or changing the contact details or the start screen. The software can also be used to download a new language file, if this feature is available.
The on-screen tool simulation can be set up and tested on a configurable load simulator to test the configuration file before downloading to a live device.
Start BlueControl
When you start the BlueControl software, you will have several options:
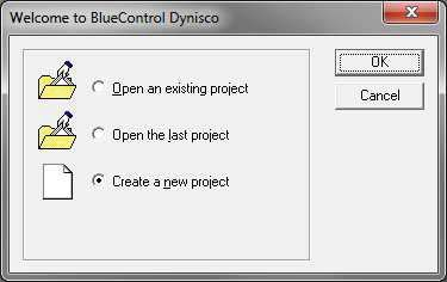
Open existing project - This will allow you to browse the existing .bct file to be loaded into BlueControl.
Open last project - Opens the last saved .bct file.
Create a new project - This will allow you to select the device and its options and introduce you to the default configuration.
The .bct files (configuration file) contain all information about the device, including optional modules and all parameter settings.
Creating a new project
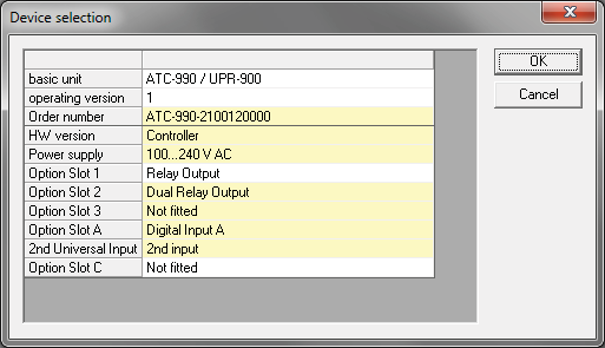
When creating a new project, the following screen will appear. Here, the device type and its optional modules should be selected to match the target device. You can select these options from the drop-down lists or, by entering the full model number, automatically select the appropriate options in the Order Number field.
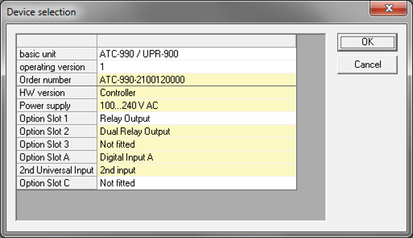 Ideally, the options on this device selection screen should match the options on the target device to download to.
Alternatively, the entire device type and existing configuration can be uploaded to a computer from your device, via the configuration socket or, if possible, via serial communication. This process is explained in Connecting to a device.
BlueControl workspace
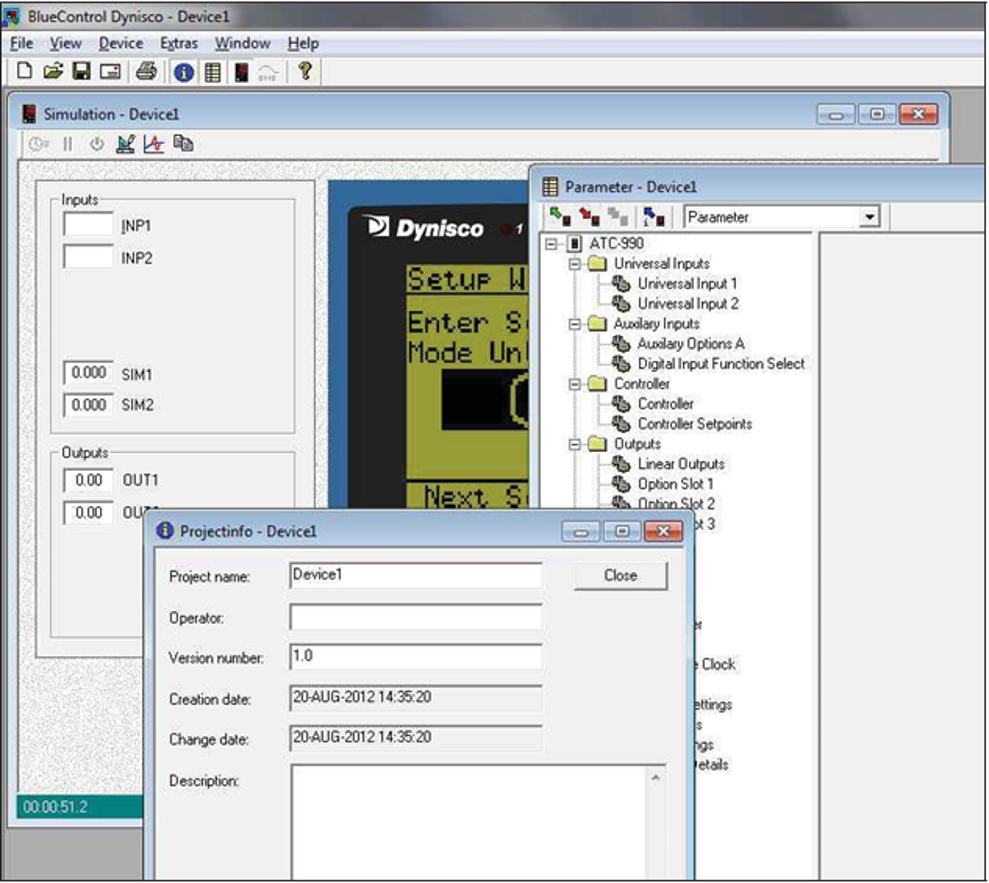
Typically, when you start a new project, the work area will have three child windows.
- Project Info - This window allows you to enter your own information to help describe / identify the current configuration project. This information is not downloaded to the device.
- Simulation - This window launches a simulated version of the selected device. It was designed to work with as much firmware code as possible in a Windows environment.
- This means that parameter changes, etc. can be saved in this simulation and tested before deployment to a physical device. For information on connecting to the simulation for uploading / downloading parameters, see the "Connection configuration" section.
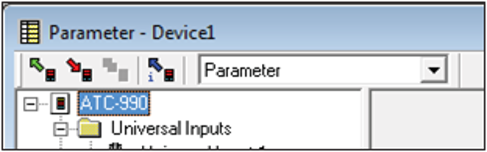
Parameter - This window is used to monitor and adjust all device parameters. Each parameter is categorized in the tree structure on the left for easy navigation and is usually displayed either as a drop-down list of available properties or has a valid range label on the right. See "Parameter Configuration" for details.
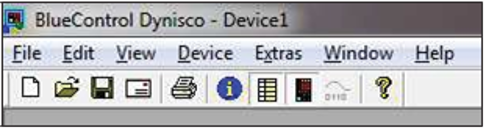
Desktop toolbar
Description of toolbar buttons from left to right:
- New - Creates a new project as described in the "Creating a New Project" section.
- Open - Browse and select the configuration file (.bct) you want to open.
- Save - Save the current configuration to a bct file.
- Mail - Opens the default mail client and attaches the current configuration as a BCT file.
- Print - Allows you to print various options.
- Project Info - Hides / Shows the Project Info window.
- Parameter and Configuration - Hides / Shows the Parameter window.
- Simulation - Hides / Shows the Device Simulation window.
- Editor - Not supported in this version.
- Program Info - Displays the standard About window.
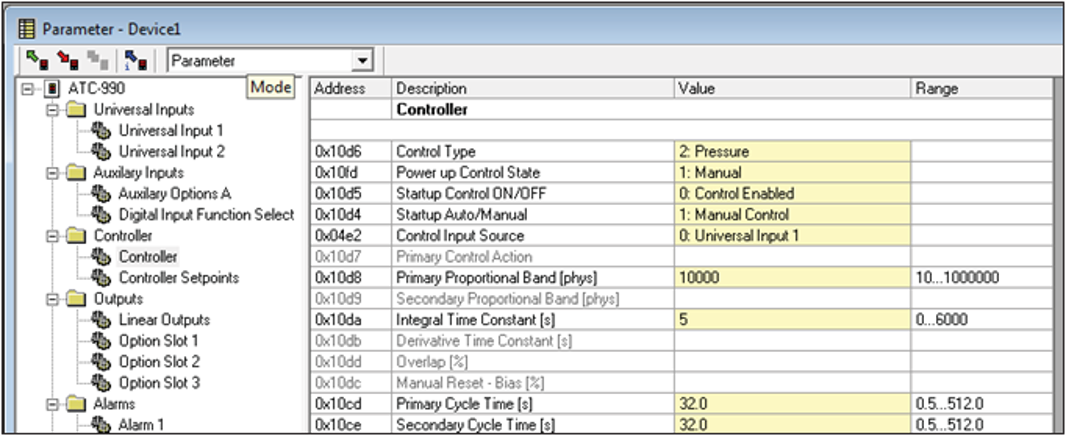
Parameters window
Blue Control is a powerful tool for quickly viewing and editing parameters before uploading them to the device.
The parameters screen contains all device settings (parameters) divided into functional groups. The parameters can be changed in the yellow Value column. Enter a new value or select from the list provided as needed. The possible range of values is displayed on the right. If an invalid value is entered, it will be highlighted in red. Parameters are "grayed out" if they are currently unavailable due to hardware not being installed or if they are disabled by other settings.
Parameters window Toolbar
Description of toolbar buttons from left to right:
- Retrieve data from device - Connects to the device and obtains all parameter settings.
- Saving data to the device - Connect to the device and set all parameters.
- Device connection - Not supported in this version.
- Device Information - Connects to, retrieves, and displays information from the device.
- Mode (drop-down list) - Different ways to display parameter information.
Simulation window
The simulation window allows the user to upload and download configurations to it and test them before deploying to real units. When using simulation, you can navigate screens and change parameters either by using the virtual simulation keys by clicking on them with the mouse pointer, or by pressing the keys associated with the keyboard. The keys you use are usually the cursor keys, but to do this you need to make sure that the front panel of the simulation has focus by clicking the mouse pointer before using the keys on the keyboard.
To the left of the simulation is the I / O panel. This allows the user to change any input values that the unit provides, such as PV, Digital Inputs, etc. This panel also displays the states or output values of the units.
The simulation panel and inputs / outputs display only the options corresponding to the device type (including optional modules) that are selected in the Device> Select Device window. Thanks to this combination of a simulated front panel and visible displays of inputs and outputs, it is possible to understand well how the unit will work.
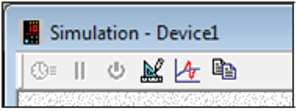
Simulation toolbar
Description of toolbar buttons from left to right:
- Turbo - Not supported in this version
- Pause - not supported in this version
- Power On / Off - Not supported in this version
- Process parameters - Settings for the simulated process. It changes how it reacts.
- Fault - Allows a fault to be introduced into the simulated process.
- Copy screen - takes a snapshot of the simulation HMI and saves it to the clipboard.
Connecting to the device
The software can communicate with the device via the configuration socket located on the device, or via the Modbus TCP or RS485 communication interface, if available.
The configuration socket is intended for the initial configuration of the device before installation in the application. An RS232 or USB to TTL cable (available from your supplier) is required to connect from a PC to this socket. A front USB port is available on some models. it can also be used to configure the device or transfer profile files via a USB memory stick.
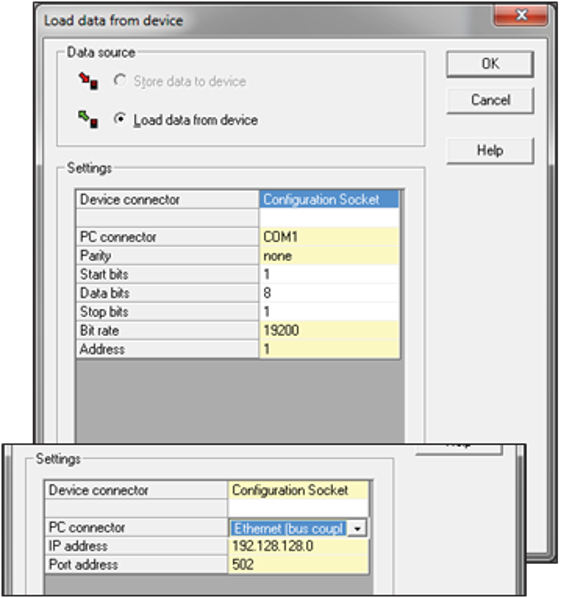
When you try to connect to the machine from the software, the communication setting screen appears. The settings must be correct for the communication to work successfully.
When connecting to a simulation (to allow uploading or downloading configurations, or to obtain recorder information), the PC connector must be set to simulation.
Change the splash screen
Some tools display graphics during the boot sequence. This can be changed from the main parameters screen. From the Device menu, select Download Home Screen.
The most common types of graphic files are supported for sending the splash screen, and the selected image is adjusted to fit the device display. Complex graphics with multiple colors or shades of gray will not reproduce well. A preview of the results is displayed. Click the Download button and save it to your device.
For best results, the image should be simple and have the same aspect ratio as the display. Ideally, it should be 160 x 80 pixels and saved as a monochrome bitmap file.
Change the alternate display language
If alternative languages are supported, they can be changed from the main parameters screen. From the Device menu, select Download Language File. Select the correct file (language files have a .bin or .bdl extension) and click Open to save it to the tool.
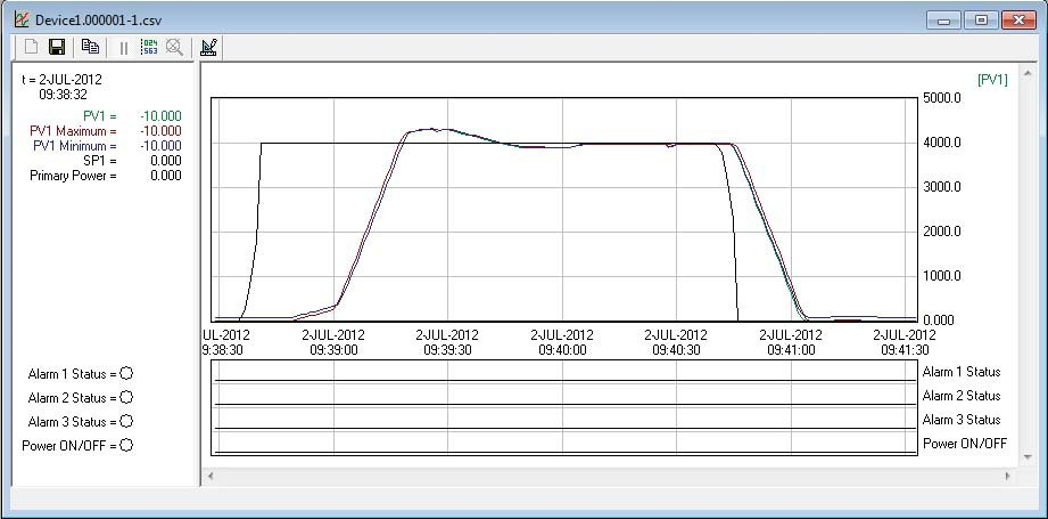
View the trend view
BlueControl provides the ability to view all recorded data (on devices equipped with a recorder module) as a trend display for visual representation. The data can then be better analyzed using functions such as zoom and cursor reading.
Get trend display data
In order to create a trend display, the recorder must first be read from the unit. Use the following method:
- From the Workspace menu, select Device> Retrieve Answering Machine Data from Device.
- Enter the file name where the received data is to be saved and click Save
- Then select the appropriate communication settings for the connected unit and click OK.
- The data will start downloading from the drive to the computer. Depending on how much data has been recorded, it may take several minutes.
After the download is complete; click File> Open Trend and select the CVS file that was saved in the previous step.
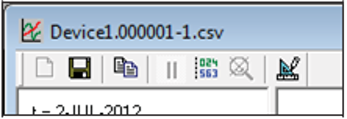
Trend View toolbar
Description of toolbar buttons from left to right:
- Reset - Not supported in this version.
- Save Trend - Saves the CVS data file.
- Copy - Captures a trend display and saves it to the clipboard.
- Pause - not supported in this version.
- Cursor - used to measure each trend at a given point.
- No zoom - Returns to the zoom view.
- Settings - Displays the settings window. Described below.
Enlargement
This is done simply by clicking and dragging the mouse over the area you want to enlarge. This can be repeated several times to further enlarge the data. To return to the full view, click the No Zoom button on the toolbar.
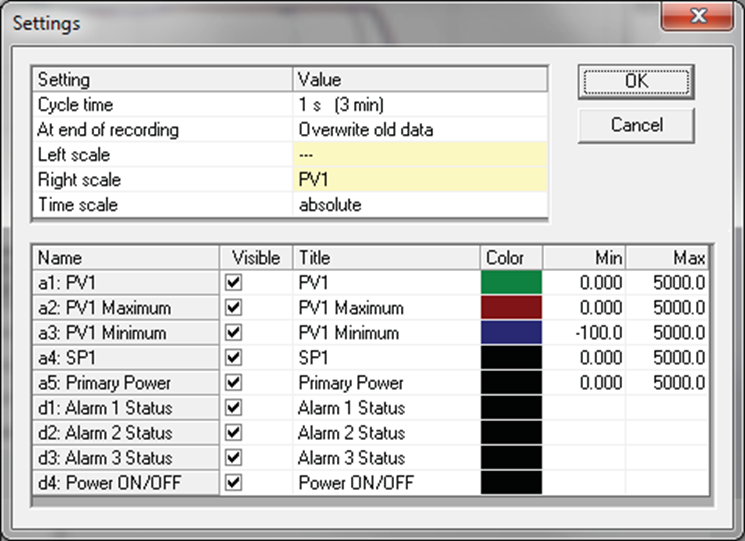
Settings window - trend display
The settings window allows the user to switch which data is displayed and the scale of these data items. If the trend view disappears from the top of the visible area, try increasing the value in the Max column of this window.